How do you show the impact of a pandemic on the economy? This is the question that gave birth to the federally funded Eastern Shore Economic Recovery Project.
In spring of 2020, local economic and workforce development professionals teamed with the data visualization specialists from Salisbury University’s Eastern Shore Regional GIS Cooperative (ESRGC) to apply for a $400,000 grant from the U.S. Economic Development Administration. Their mission: create data-driven tools that local governments, businesses, and organizations need to understand an economic crisis such as a global pandemic and to gauge the corresponding economic recovery.
“The Mid-Shore Regional Council’s goal was to support our counties by creating resources that would help the economic development offices support the business community as it recovers from the COVID-19 pandemic,” says Executive Director Scott Warner, who is managing the project with Greg Padgham, who leads the Tri-County Council of the Lower Eastern Shore of Maryland.
“The tools we are creating will result in data-driven strategies that will help the region recover from the economic shock of the pandemic, build additional resiliency against future events, and be a resource of reliable data for discussions, decision making, and grant applications,” Warner continued.
In addition to the two regional councils and the ESRGC, partners include the Lower Shore Workforce Alliance, the Upper Shore Workforce Investment Board, and the Caroline, Dorchester, and Talbot County economic development offices.
Now more than a year into the two-year project, the team is ready to release the suite of tools they’ve developed to date.
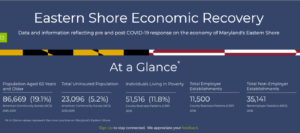
- A central website introduces the project and houses all of the products that currently have been developed. It also offers quick, easy access to key economic indicators and uses publicly accessible data from resources such as the U.S. Census Bureau, American Community Survey, and County Business Patterns. Data visualizations include interactive dashboards, web mapping applications, and interactive reports, in addition to key points and summaries.
- Using information from the Maryland Comptroller’s Office, the ESRGC developed a series of dashboards that show Maryland sales tax collections across years, across county boundaries, and across industries. Users can filter for fiscal year, region, and specific industry groups. The tax data visualizations correspond with a second line chart that shows the number of statewide COVID-19 cases and plots the influx of federal economic stimulus.
- The local economic development offices in Caroline, Dorchester, and Talbot counties administered a 50-question survey designed by Salisbury University’s Business Economic and Community Outreach Network (BEACON). The survey will be repeated at regular intervals, and the data will be used to track business sentiment local and regionally, identify challenges facing the region, and assist in long-term planning and the development of public policy. ESRGC is currently developing visualization tools to showcase the survey results.
The project team spent hours evaluating and assembling the different data sources needed to show the economic impact of the pandemic and the information needed to help prepare for future economic crises. While much of the data used for the Eastern Shore Economic Recovery Project is not new information, the ESRGC team has spent considerable time shaping it into a useful format.
“At the ESRGC, we are data people,” says Dr. Michael Scott, dean of the Henson School of Science and Technology at Salisbury University. “We spend a lot of our time collecting data, massaging data, and turning it into information people can use.

“Many of these data sources exist elsewhere, but were not in a form that was particularly useful for anyone to be able to use it to make actual decisions,” he explains. “An extreme amount of work was necessary to get this data into a place where you could actually see it, use it, touch it and make actionable decisions with it.”
The tools created for the Eastern Shore Economic Recovery Project will have many uses, Scott predicts. First and foremost, they give decision makers a way to track the status of the local economy, giving them the information they need to understand long-term trends and anticipate challenges.
This information can also be used for planning purposes. “It’s important to be able to think about the impact of the pandemic, what can we now do, and how can we put various support structures in place so that if something like that was to happen again, we would be ready,” Scott says.
Project manager Erin Silva, who heads up the ESRGC’s web development and data visualization team, says the group has avoided focusing solely on creating tools for the pandemic, but are taking a broader approach and are developing tools that can be used in any economic crisis.
“We’re not just looking at right now and what has happened over the past year and a half,” Silva explains. “We’re trying to figure out how we can position ourselves to make use of this time and experience to better respond to future economic downturns. We’re preparing for the future.”
Scott agrees, noting that the tools they’re developing now will transcend time. “We will eventually move past this crisis,” he says. “There are some segments of the economy that have moved past it already. There are others that have not. But this will not be the last blip that the regional economy has to face. We are hoping that now that these things are built, they can be maintained relatively inexpensively and be useful for a long time.”
The Eastern Shore Economic Recovery Project will ultimately end up as a part of the Delmarva Index, a tool the ESRGC has developed as a centralized repository that provides streamlined access to data and visualization of information about the Delmarva Peninsula, including Delaware, the Eastern Shore of Maryland, and the Eastern Shore of Virginia.

“The internet is a literal firehose of information,” says Dr. Michael Scott. “We curate that data, make sure it is valid, make sure it is error free, at least as much as we can, and then publish it in a way that people can access easily. That is the goal of the Delmarva Index. This pandemic response data collection effort is just an extension of that project for a very specific set of data regarding economic activity pre- and post-COVID-19.”
The tools will also become part of the strategies employed by both regional councils. The Mid-Shore Regional Council and the Tri-County Council of the Lower Eastern Shore are recognized by the U.S. Economic Development Administration as Economic Development Districts and are required to develop and maintain regional Comprehensive Economic Development Strategies (CEDS).
Project partners will share the information publicly in a series of meeting with the governing bodies of the three counties actively involved. A work session with the Talbot County Council was held July 27 at 3:30 p.m., followed by a presentation to the Caroline County Commissioners on Aug. 3 at 9 a.m. The date for the Dorchester County presentation has not yet been set.
Scott and Silva, along with their partners, invite feedback from users. “I would really encourage people to reach out and ask questions,” Scott says. “The creative energy of the majority often finds things that end up making our projects better.”
To access the Eastern Shore Economic Recovery Project, visit recovery.delmarvaindex.org. The complete Delmarva Index can be found at delmarvaindex.org.