Talbot County is a great place to live, work, and visit, but don’t take our word for it. The economic data tells the story for us.
Explore Talbot County by the numbers through the interactive maps of the Maryland State Economic Dashboard,, a product created by the Eastern Shore Regional GIS Cooperative with a grant from the U.S. Economic Development Administration.
The dashboard includes the most current data on demographics, education, housing, commuting, income, GDP, employment, labor force, and business.
ABOUT THE MARYLAND STATE ECONOMIC DASHBOARD
The Maryland State Economic Dashboard provides quick and easy access to demographic, economic, and social data for all Maryland counties and Baltimore City. While all the pages utilize a similar design and functionality, there are slight differences including data sources, data vintages, and availability of sup-tabs within the pages.
The interactive dashboards utilize the most current available data from sources including the U.S. Census Bureau; Maryland Department of Education; U.S. Department of Education, National Center for Education Statistics; U.S. Bureau of Labor Statistics; and the U.S. Bureau of Economic Analysis.
Below you’ll find images of Talbot County data taken from the dashboard in August 2024.
SEE ALSO: More Economic Dashboards
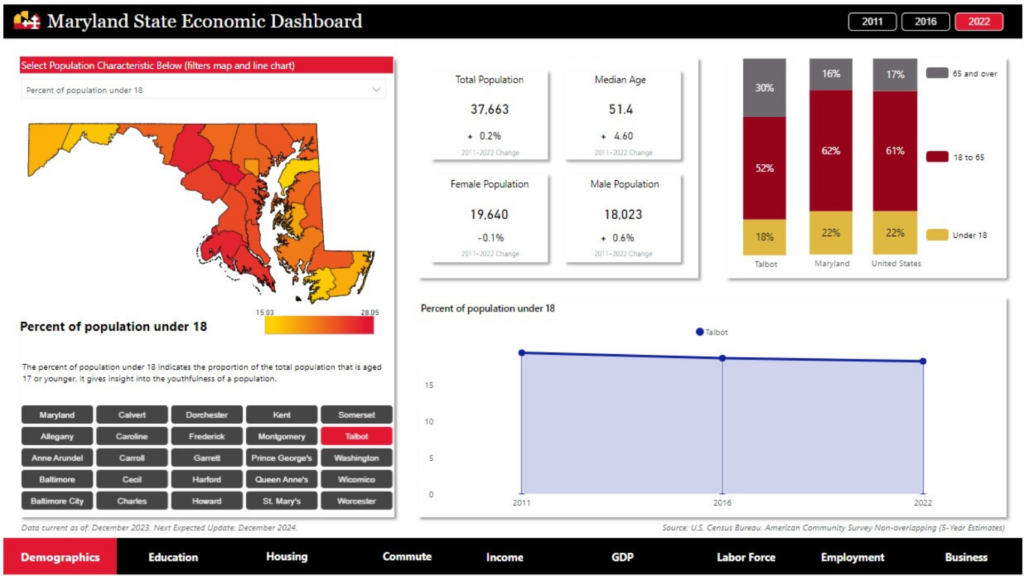
Talbot County Dashboard: Demographics
Data Source/See the Most Up-to-Date Data Here: Maryland State Economic Dashboard
Screenshot is from August 2024 (Please click on the below image to enlarge)
KEY DEMOGRAPHIC HIGHLIGHTS:
- TALBOT COUNTY TOTAL POPULATION:
37,663 | +0.2% 2011- 2022 Change - TALBOT COUNTY MEDIAN AGE:
51.4 | +4.60% 2011- 2022 Change - TALBOT COUNTY FEMALE POPULATION:
19,640 | -0.1% 2011- 2022 Change - TALBOT COUNTY MALE POPULATION:
18,023 | +0.6% 2011- 2022 Change
(Click here to navigate back to top of page)
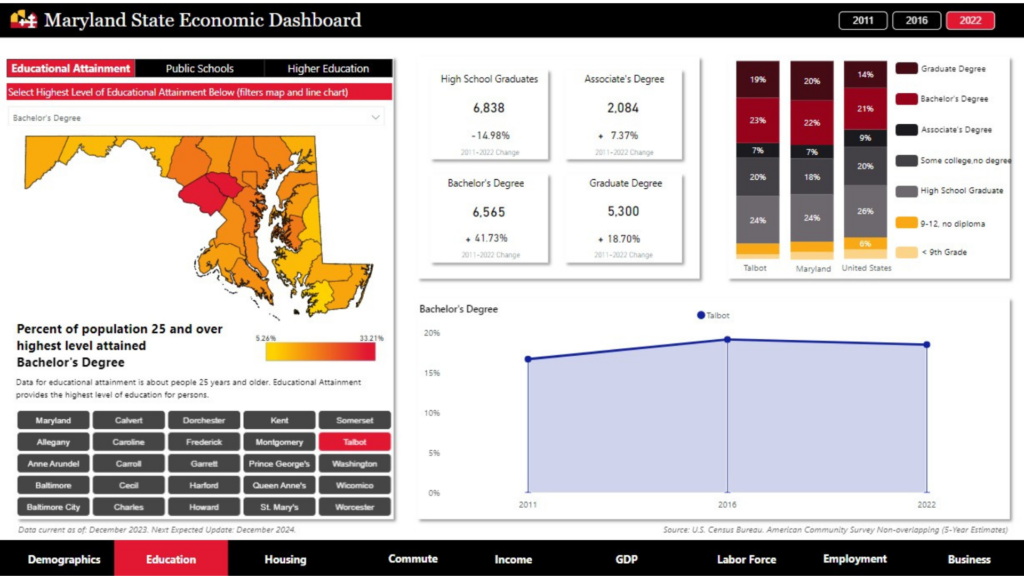
Talbot County Dashboard: Education
Data Source/See the Most Up-to-Date Data Here: Maryland State Economic Dashboard
Screenshot is from August 2024 (Please click on the below image to enlarge)
KEY EDUCATION HIGHLIGHTS:
- TALBOT COUNTY HIGH SCHOOL GRADUATES:
6,838 | -14.98% 2011- 2022 Change - TALBOT COUNTY ASSOCIATE’S DEGREE:
2,084 | +7.37% 2011- 2022 Change - TALBOT COUNTY BACHELOR’S DEGREE:
6,565 | +41.73% 2011- 2022 Change - TALBOT COUNTY GRADUATE DEGREE:
5,300 | +18.70 % 2011- 2022 Change
(Click here to navigate back to top of page)
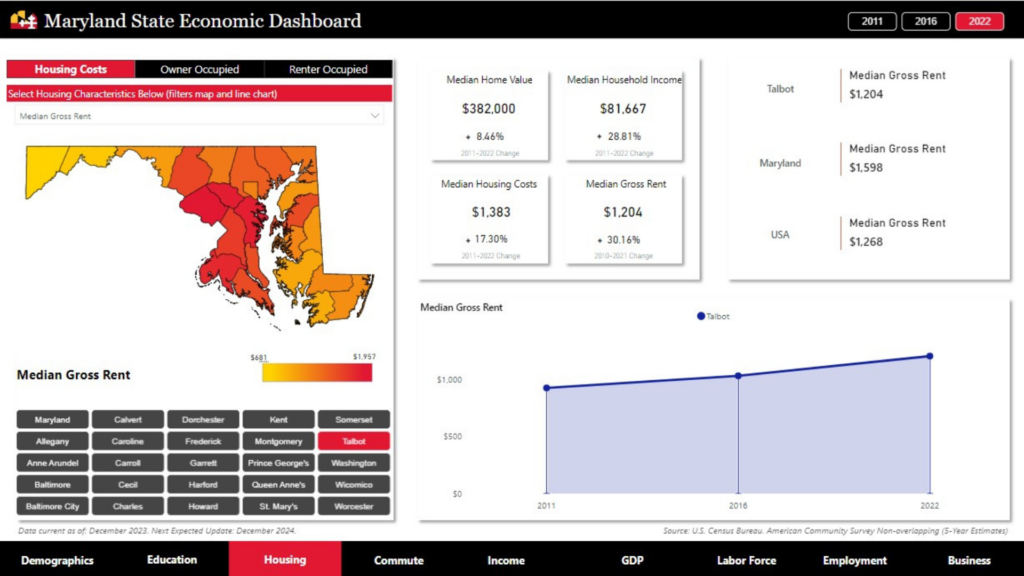
Talbot County Dashboard: Housing
Data Source/See the Most Up-to-Date Data Here: Maryland State Economic Dashboard
Screenshot is from August 2024 (Please click on the below image to enlarge)
KEY HOUSING HIGHLIGHTS:
- TALBOT COUNTY MEDIAN HOME VALUE:
$382,000 | +8.46% 2011- 2022 Change - TALBOT COUNTY HOUSEHOLD INCOME:
$81,667 | +28.81% 2011- 2022 Change - TALBOT COUNTY MEDIAN HOUSING COST:
$1,383| +17.30% 2011- 2022 Change - TALBOT COUNTY MEDIAN GROSS RENT:
$1,204 | +30.16% 2011- 2021 Change
(Click here to navigate back to top of page)
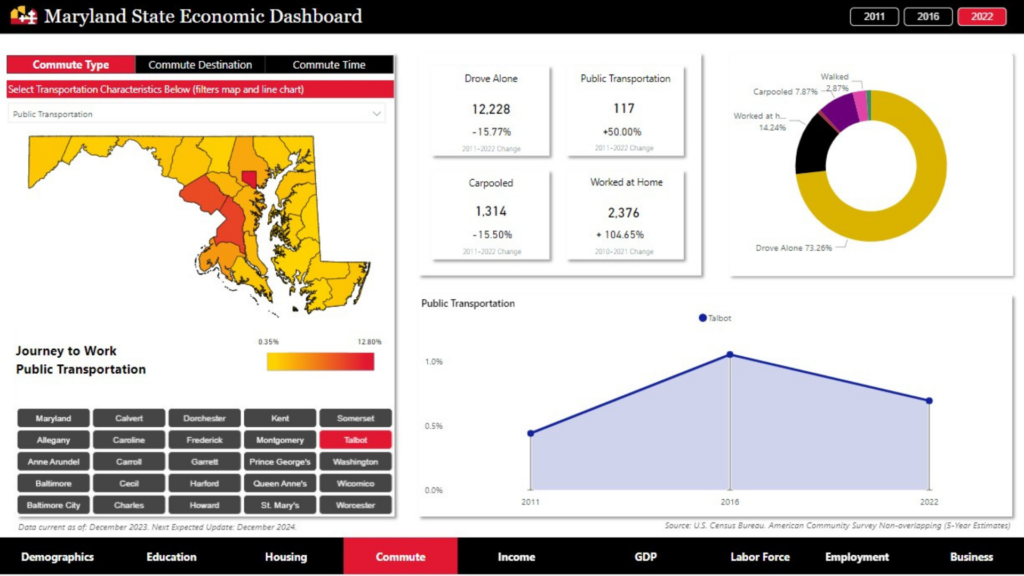
Talbot County Dashboard: Commute
Data Source/See the Most Up-to-Date Data Here: Maryland State Economic Dashboard
Screenshot is from August 2024 (Please click on the below image to enlarge)
KEY COMMUTE HIGHLIGHTS:
- TALBOT COUNTY DROVE ALONE:
12,228 | -0.15.77% 2011- 2022 Change - TALBOT COUNTY PUBLIC TRANSPORTATION:
117 | +50.00% 2011- 2022 Change - TALBOT COUNTY CARPOOLED:
1,314 | -15.50% 2011- 2022 Change - TALBOT COUNTY WORKED AT HOME:
2,376 | +104.65% 2010- 2021 Change
(Click here to navigate back to top of page)
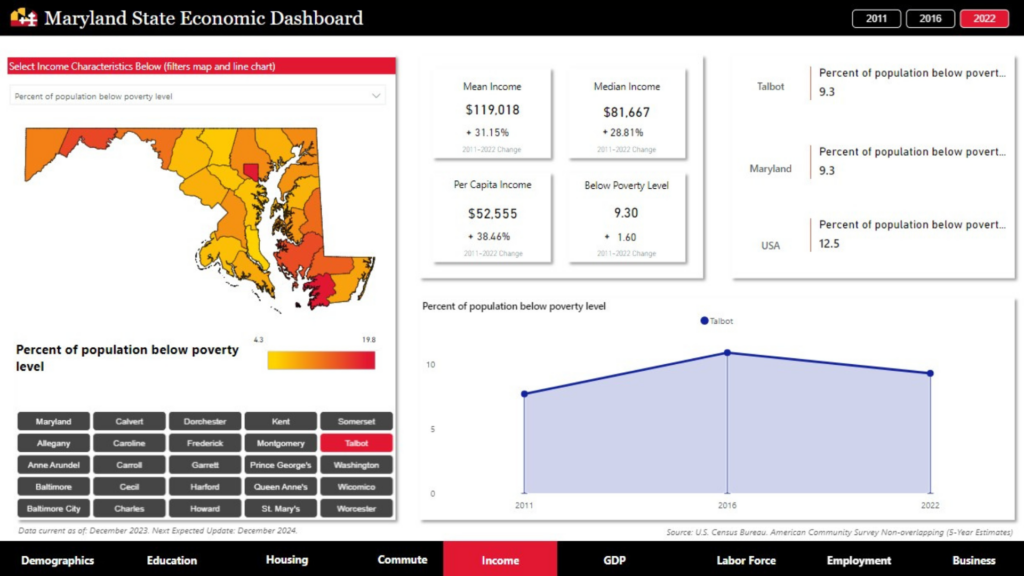
Talbot County Dashboard: Income
Data Source/See the Most Up-to-Date Data Here: Maryland State Economic Dashboard
Screenshot is from August 2024 (Please click on the below image to enlarge)
KEY INCOME HIGHLIGHTS:
- TALBOT COUNTY MEAN INCOME:
$119,018 | +31.15% 2011- 2022 Change - TALBOT COUNTY MEDIAN INCOME:
$81,667 | +28.81% 2011- 2022 Change - TALBOT COUNTY PER CAPITA INCOME:
$52,555 | +38.46% 2011- 2022 Change - TALBOT COUNTY BELOW POVERTY LEVEL:
9.30% | +1.60% 2011- 2022 Change
(Click here to navigate back to top of page)
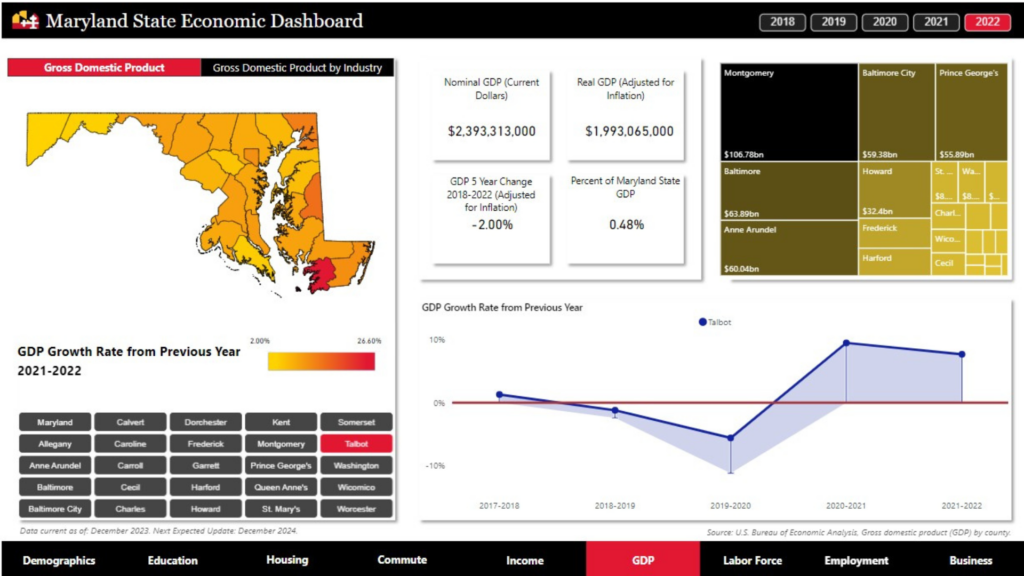
Talbot County Dashboard: GDP
Data Source/See the Most Up-to-Date Data Here: Maryland State Economic Dashboard
Screenshot is from August 2024 (Please click on the below image to enlarge)
KEY GDP HIGHLIGHTS:
- TALBOT COUNTY NOMINAL GDP (Current Dollars):
$2,393,313,000 - TALBOT COUNTY REAL GDP (Adjusted for Inflation):
$1,993,065,000 - TALBOT COUNTY 5-YEAR CHANGE 2018-2022 (Adjusted for Inflation):
-2.00% - TALBOT COUNTY PERCENT OF MARYLAND STATE GDP:
0.48%
(Click here to navigate back to top of page)
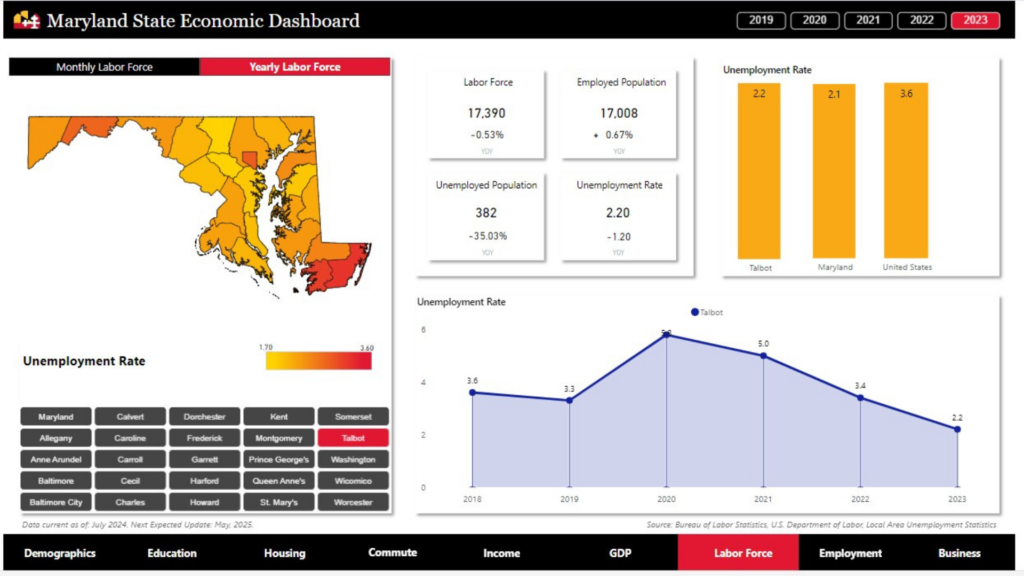
Talbot County Dashboard: Labor Force
Data Source/See the Most Up-to-Date Data Here: Maryland State Economic Dashboard
Screenshot is from August 2024 (Please click on the below image to enlarge)
KEY LABOR FORCE HIGHLIGHTS:
- TALBOT COUNTY LABOR FORCE:
17,390 | -0.53% YOY - TALBOT COUNTY EMPLOYED POPULATION:
17,008 | +0.67% YOY - TALBOT COUNTY UNEMPLOYED POPULATION:
382 | -35.03% YOY - TALBOT COUNTY UNEMPLOYED RATE:
2.20 | -1.20% YOY
(Click here to navigate back to top of page)
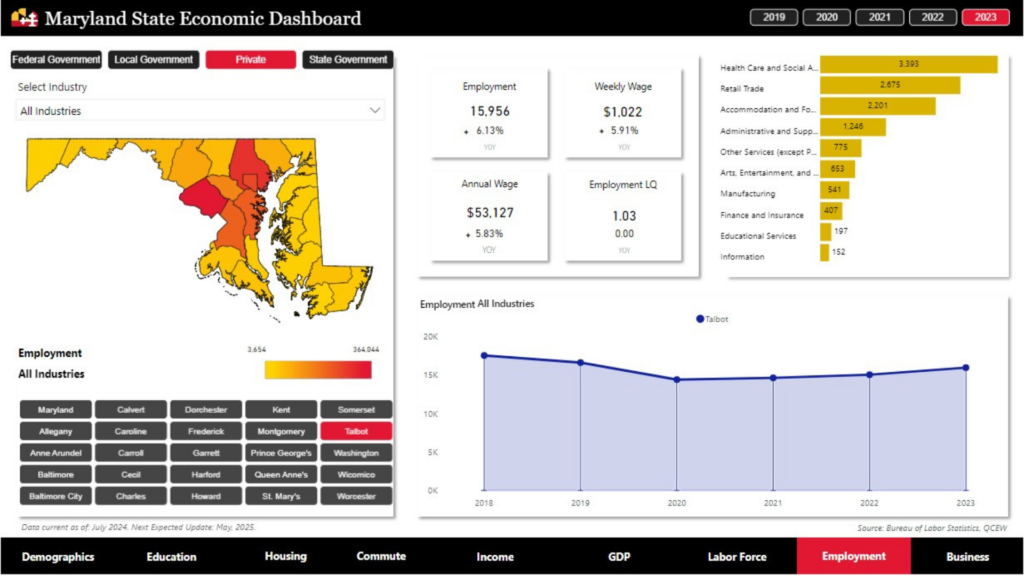
Talbot County Dashboard: Employment
Data Source/See Most Up-to-Date Data: Maryland State Economic Dashboard
Screenshot is from August 2024 (Please click on the below image to enlarge)
KEY DEMOGRAPHIC HIGHLIGHTS:
- TALBOT COUNTY TOTAL POPULATION:
37,663 | +0.2% 2011- 2022 Change - TALBOT COUNTY MEDIAN AGE:
51.4 | +4.60% 2011- 2022 Change
(Click here to navigate back to top of page)
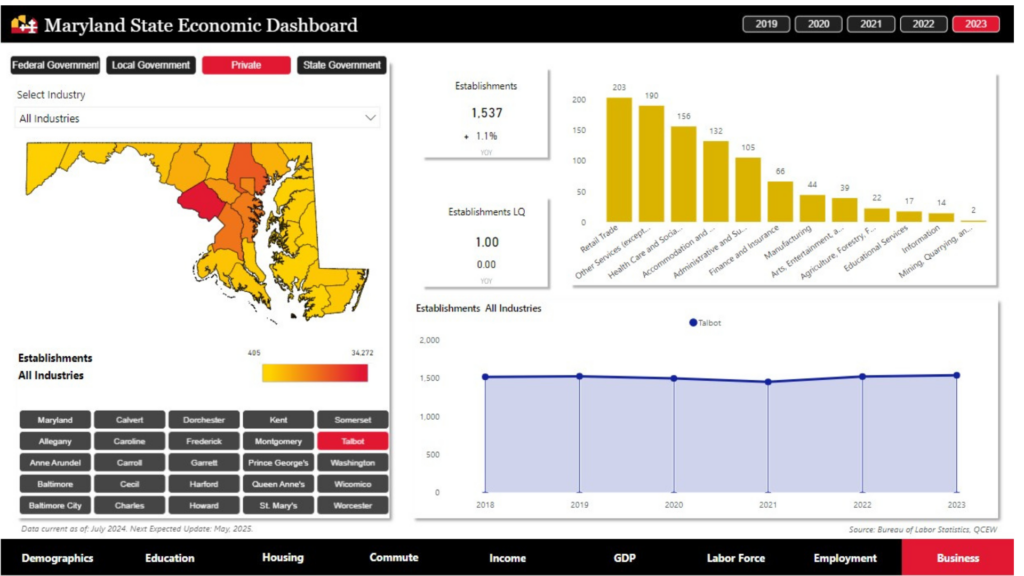
Talbot County Dashboard: Business
Data Source/See Most Up-to-Date Data: Maryland State Economic Dashboard
Screenshot is from August 2024 (Please click on the below image to enlarge)
KEY BUSINESS HIGHLIGHTS:
- TALBOT COUNTY ESTABLISHMENTS:
1,537 | +1.1% YOY - TALBOT COUNTY ESTABLISHMENTS LQ:
1 | +0.00% YOY
(Click here to navigate back to top of page)
More Economic Dashboards from Maryland Dept. of Commerce
Data in from these EDA Resilience Project Dashboards can be filtered in a variety of ways and easily viewed through maps, graphs, and charts to compare across different variables, helping users identify trends. Interact with the four different dashboards below and gain insight into data highlighting Maryland’s manufacturing sector, workforce, and economic performance.
Use the following links to access the dashboards:
- Maryland Manufacturing Industry Dashboard
- Maryland Manufacturing Workforce Dashboard
- Maryland Transferable Skills Dashboard
- Maryland Economic Dashboard

About Talbot County Department of Economic Development and Tourism
The Talbot County Department of Economic Development and Tourism’s mission is to enhance and promote a business-friendly environment for current and prospective enterprises and to advocate for policies that support and strengthen the economic vitality of Talbot County. The department’s vision for Talbot County is built on the principles of strong communities, empowered businesses, and innovative solutions.
Never Miss Talbot County Business News:
Subscribe to the Talbot Works newsletter here.
Wait! Before You Go!
Don’t forget to Explore Talbot County with us here.